
In the software testing process, Boundary Value Analysis (BVA) is a black-box testing technique used to test the behavior of software within specific boundaries. By focusing test scenarios around boundary values, it helps detect defects early while ensuring time and resource efficiency. Of course, like any method, it has both advantages and disadvantages. Since it focuses solely on boundary values, potential errors that lie in the middle of the range may be overlooked.
There are two versions of BVA: 2-value and 3-value. These versions are named based on how many coverage elements are considered for each boundary value. In 2-value BVA, the coverage elements include the boundary value itself and the nearest neighbor from the adjacent range. Coverage is measured by dividing the number of tested boundary values by the total number of defined boundary values, and it is expressed as a percentage. In 3-value BVA, the coverage elements include the boundary value itself and both neighboring values from the adjacent ranges. Coverage is calculated by dividing the number of tested boundary values and their neighbors by the total number of all defined boundary values and neighbors, also expressed as a percentage. In both versions, achieving 100% coverage requires testing all coverage elements.
Example: A university system assigns letter grades based on exam scores.
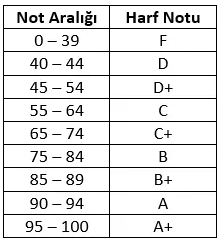
Figure 1: University Grading System Table
According to the grading table, there are 9 different letter grades, each associated with a specific score range. Based on these rules, there are 18 coverage elements in the 2-value BVA approach. (0, 39, 40, 44, 45, 54, 55, 64, 65, 74, 75, 84, 85, 89, 90, 94, 95, 100). To reach 100% coverage, the system must be tested using all these data points. If only 12 of these elements are tested, coverage will be 66.67%.
In 3-value BVA, there are 26 coverage elements. (0, 1, 39, 40, 41, 44, 45, 46, 54, 55, 56, 64, 65, 66, 74, 75, 76, 84, 85, 86, 89, 90, 91, 94, 95, 96, 100). To reach 100% coverage, all of these data points must be tested. If only the 12 coverage elements from the 2-value BVA are tested, the coverage will be 46.15%.
In this example, the value 80 is neither a boundary value nor a neighboring value in either version, so it is not included in the coverage elements. Therefore, if a test case does not include the value 80, any potential bug triggered by it may go unnoticed. The main drawback of BVA is the risk of overlooking defects in normal (non-boundary) values. However, since developers are more likely to make mistakes at boundary points, most defects tend to occur around these boundaries.
In conclusion, Boundary Value Analysis is a crucial testing technique used to enhance software reliability, and when applied correctly, it offers significant benefits.